Track everything
One normalised ledger across all your brokers and accounts, settled to your base currency.
- CSV import, ~190 broker formats
- Multi-account & FX-aware
- Buys, sells, dividends, fees, splits
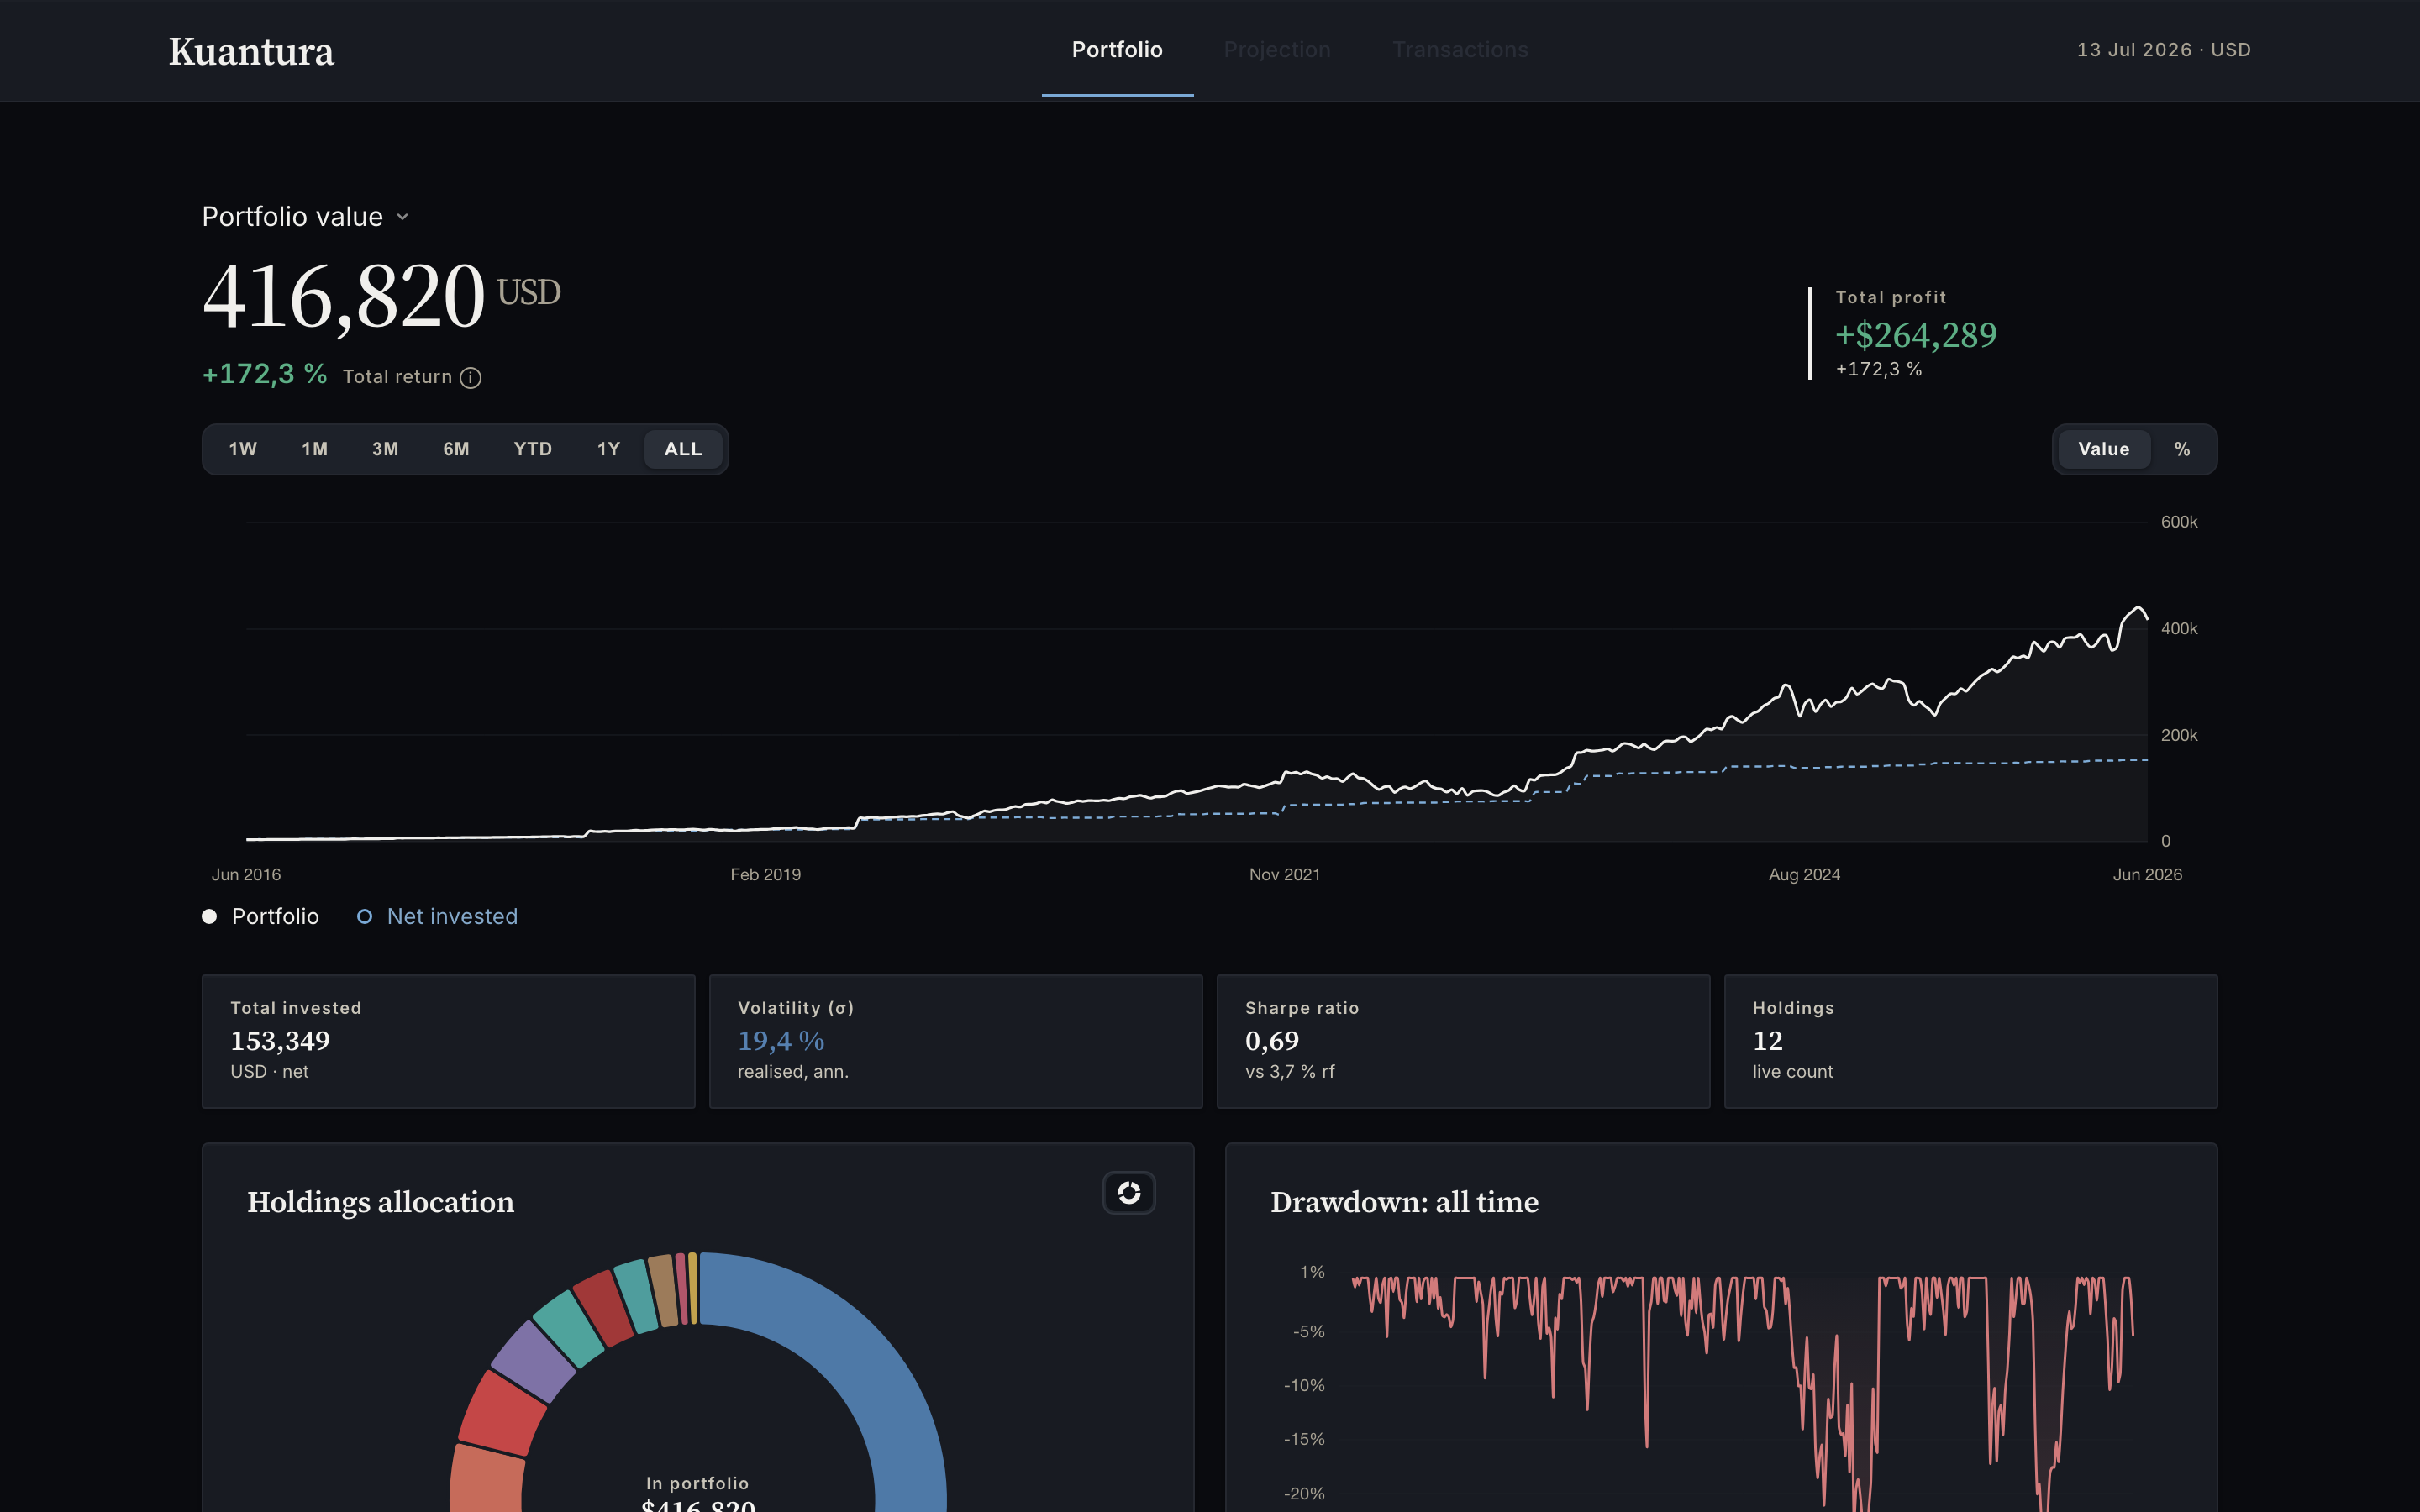
Every holding, every broker, in one view, with the real flow-adjusted return, the risk, and the forecast your bank app quietly leaves out.
Imports a CSV from your broker
Everything in one place
Track what you own, measure how it really behaves, and forecast where it's heading, all from the same calibrated model.
One normalised ledger across all your brokers and accounts, settled to your base currency.
The metrics your bank app hides, measured against the benchmark you choose.
Monte Carlo calibrated to your holdings. A distribution, not a fairy tale.
Asset allocation
Break your whole portfolio down by holding, asset class or sector: the diversification your bank app never bothers to show. Explore it live in the deck alongside.
Compare your portfolio against the S&P 500, NASDAQ 100, MSCI World or OSEBX, or any individual stock or ETF you pick.
Sharpe, Sortino, Calmar and beta, all measured against the benchmark you choose, so you can weigh return against the risk you actually took.
See how much of your return is genuine skill versus the market's pull, and how your book holds up when markets rise versus fall.
Portfolio value
Works with your broker
Export a CSV from your broker and drop it in. Kuantura recognises around 190 formats and normalises every line, so you’re up and running in minutes. No broker login, no passwords, ever.
Don’t see yours? The importer auto-detects most CSV layouts, or you can add holdings by hand.
Quantitative forecasting
Your bank's pension calculator draws one smooth line at 7% a year. Real markets don't compound smoothly. Kuantura simulates thousands of paths so you can feel the variance you're actually taking on, and plan against the range, not the wish.
Try demo →—
Reporting
Generate a clean, professional portfolio report covering performance, allocation, holdings and income, with an auto-written narrative and an "as of" date. Export to PDF or CSV and share it in a click.
Your portfolio is up $264,289 (172,3 %) since inception, vs +17,8 % the year before
Pricing
Kuantura is rolling out in waves. Request access on the plan you'd actually use. Founding members lock the early-access price.
Free
Core tracking, free. See your whole portfolio clearly.
Pro
The full toolkit. Every metric, every account, no limits.
Firms
For family offices and advisors managing more than their own book.
Plans apply at public launch. Invited early-access members use Kuantura in full while we iterate, and keep the founding Pro price when billing starts. No card required to join the list.
Questions
Request early access. When your invite lands, import a CSV from your broker and get every holding, metric and trend in one honest place.